Top 5 Technical Indicators Every Trader Should Know.
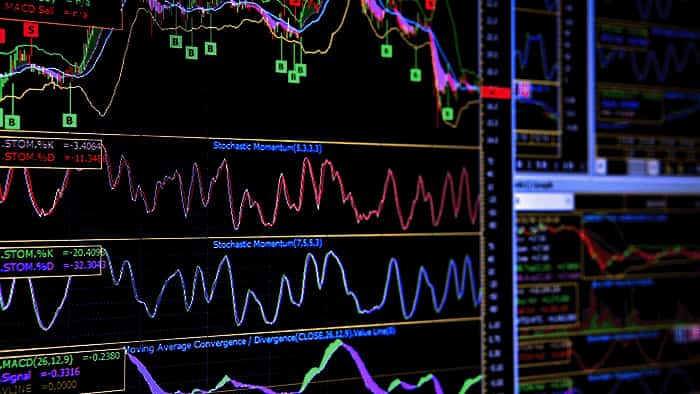
Technical indicators play a vital role in helping traders analyze market trends and make informed trading decisions. These indicators are mathematical calculations based on price, volume, or open interest data, and they are commonly displayed on trading charts to help identify patterns and potential entry or exit points.
One of the most widely used indicators is the Moving Average (MA). Moving averages help smooth out price data to identify the direction of a trend. Traders often use the 50-day and 200-day moving averages to determine whether a market is in an uptrend or a downtrend. When a short-term moving average crosses above a long-term moving average, it may signal a potential buying opportunity.
Another popular indicator is the Relative Strength Index (RSI). RSI measures the speed and change of price movements on a scale from 0 to 100. When the RSI rises above 70, the asset may be considered overbought, while readings below 30 suggest that the asset may be oversold. Traders use this information to identify potential reversals in the market.
The Moving Average Convergence Divergence (MACD) is another powerful tool used to identify trend changes and momentum. It consists of two moving averages and a histogram that shows the difference between them. When the MACD line crosses above the signal line, it may indicate a bullish trend, while a downward crossover may signal a bearish trend.
Bollinger Bands are also widely used by traders to measure market volatility. These bands consist of a moving average and two standard deviation lines above and below it. When the bands expand, volatility increases, and when they contract, the market becomes less volatile.
Lastly, Volume is an essential indicator that shows how many shares or contracts are traded during a specific period. High trading volume often confirms the strength of a price movement, while low volume may indicate weak momentum.
Although technical indicators are useful tools, traders should avoid relying on a single indicator alone. Combining multiple indicators with proper risk management and market analysis can significantly improve trading decisions.
In conclusion, understanding and effectively using technical indicators can help traders identify trends, manage risk, and improve their overall trading strategies. By mastering these tools and practicing consistently, traders can develop a more structured and confident approach to navigating the financial markets.
"A data-driven trading specialist who excels in AI-powered market analysis,
algorithmic strategies, and financial visualization. With a sharp analytical
mindset and a passion for decoding market trends, they transform complex
financial data into actionable insights through cutting-edge AI tools and
quantitative modeling. Their expertise spans algorithmic trading, technical
analysis, and real-time risk assessment—turning raw market signals into
profitable opportunities."